
Calibrate synthetic shoppers
Calibration shapes your pool of synthetic shoppers to match your real audience. Squoosh reads your connected analytics source and builds an audience whose mix of devices, traffic sources, and locations matches your actual visitors. The pool is reused across every experiment, so results stay comparable. Calibrate once per property before your first experiment, and recalibrate when your traffic changes.
Before you start
Connect Shopify or Google Analytics for the property under Integrations. Squoosh can build a pool without a connected source, but it falls back to a general e-commerce audience. Connecting a source is what shapes the pool to your real traffic and makes the Shopper match score available.
If you link Google Analytics while adding the property, Squoosh skips the general audience entirely: it analyzes your GA4 audience and builds your first pool of 1,000 shoppers from it. The page reads Analyzing your GA4 audience and then Building shoppers from your GA4 audience while it works. If GA4 has no usable data for the site yet, you get the general audience instead and can calibrate from GA4 later.
Calibrate your pool
- In the sidebar, click Synthetic Shoppers.
- If you have no pool yet, the page shows No synthetic shoppers yet.
- Click Calibrate shoppers. There's no size to choose — Squoosh calibrates the pool for you.
- Wait for calibration to finish. The status pill reads Calibrating… while Squoosh studies your traffic and drafts the shoppers, then Calibrated when the pool is ready.
The pool fills with named shoppers you can inspect. To rebuild the pool later — after your traffic shifts — click Recalibrate. Calibration takes a few minutes while Squoosh studies your traffic and drafts the shoppers.
Calibrate from your Google Analytics audience
With Google Analytics connected, switch the pool panel to the Audience view to see who your real shoppers are and match your synthetic shoppers to them. Connecting GA4 to an existing property never changes your shoppers by itself: you choose.
- Pick a window (last 28 days, 90 days or 12 months) and click Analyze my GA4 audience. Squoosh only reads your GA4 reports; nothing is sent to Google. If you'd rather not, click Keep random shoppers.
- Review the breakdown: the biggest differences from a typical site, Who they are (device, country with top regions and cities, language, age, gender) and How they arrive (channel, new vs returning). Each tile says Calibrated, Not available – hidden by Google Signals or Not enough data; a field without enough data keeps the typical mix. Data quality notes any sampling or hidden rows and lists the hostnames included.
- What calibration will change compares your current shoppers with the calibrated pool, field by field. The preview is exactly what gets built.
- Click Calibrate 1,000 shoppers from this data and confirm. Past experiment results keep the shoppers they ran with.
A calibrated pool reads Shoppers calibrated from GA4 with the month and window. To recalibrate, click Re-analyze in the Audience view; Recalibrate is hidden for a pool you chose here. Switch back to random shoppers rebuilds a general 100-shopper pool. Calibrate and Switch back are unavailable while an experiment on the property is running.
Read the Shopper match score
The Shopper match tile reports how closely your synthetic pool matches your recorded traffic, as "N% across K calibrated attributes." The percentage is the distribution overlap between your real visitors and your synthetic audience; the denominator names how many attributes were actually matched to real data, so the number never claims more than it measured. A match of 80% or higher is strong.
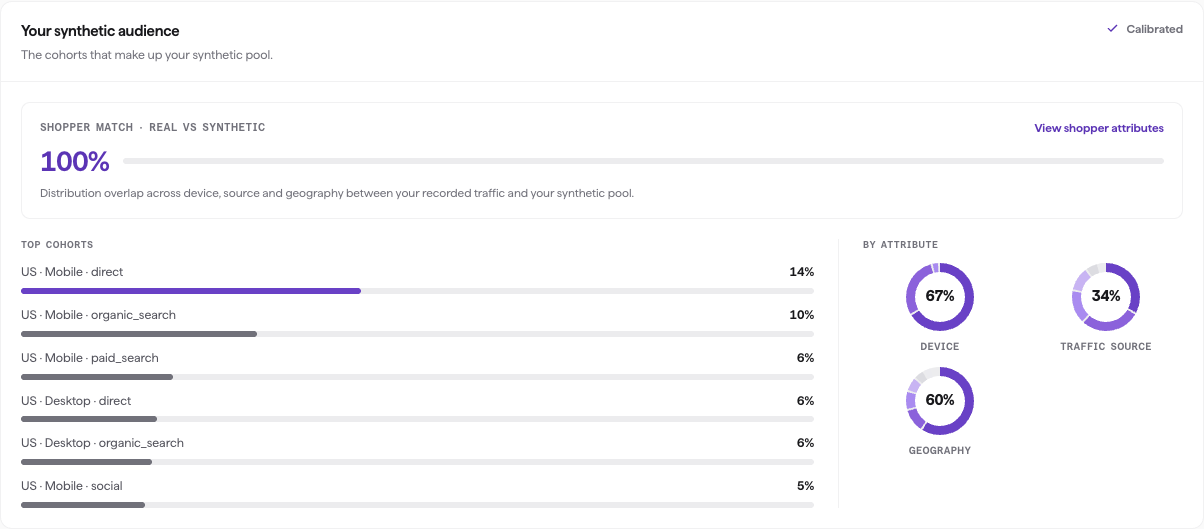
The Shopper match meter, with the top cohorts and the by-attribute breakdown beside it.
The tile shows a score only once a pool exists and real traffic is available to compare against. Squoosh never fills in a number it can't measure:
- With a source connected and recorded traffic to compare against, the tile shows the match percentage and reads Traffic mix matched to Google Analytics or Shopify.
- Without a connected source or any recorded traffic yet, the tile reads Connect Shopify or Google Analytics and shows no score.
Switch the pool panel to the Calibration view (or click View calibration) to open the attribute matrix. Each attribute is a row with a label that says exactly how it was calibrated: Calibrated · GA4 / Shopify (matched to your traffic, with a per-attribute match %), Default mix (a default e-commerce mix, not your data), Not modeled or Unavailable (visitor type, age and gender are measured only for a pool calibrated from your GA4 audience), and Modeled (behavioral traits, which are always modeled priors, never measured). Only Calibrated attributes count toward the headline percentage. Use Re-sync to refresh against your latest data.
If the match is below 80%, confirm the correct analytics source is connected for the property.
Inspect a shopper
Each shopper mirrors a slice of your traffic. A pool calibrated from GA4 has 1,000 shoppers, shown 100 per page; the summaries above the grid always cover the whole pool. Click a shopper in the grid to open its detail. You'll see its name, country, and a Device · source line, its city or region and language when the pool was calibrated from GA4, a short bio, and any needs or pain points. Four trait bars describe how it shops, each as a percentage:
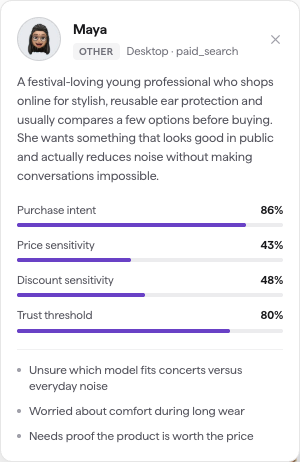
A shopper's detail, with the four trait bars and its needs and pain points.
| Trait | What it measures |
|---|---|
| Purchase intent | How ready the shopper is to buy. |
| Price sensitivity | How much the price affects the decision. |
| Discount sensitivity | How much a discount or promotion moves the shopper. |
| Trust threshold | How much reassurance the shopper needs before buying. |
The pool panel also breaks your audience down By attribute across device, traffic source, and geography, so you can see the makeup of the pool.
Next steps
Once your pool reads Calibrated, you're ready to test. See Run an experiment.